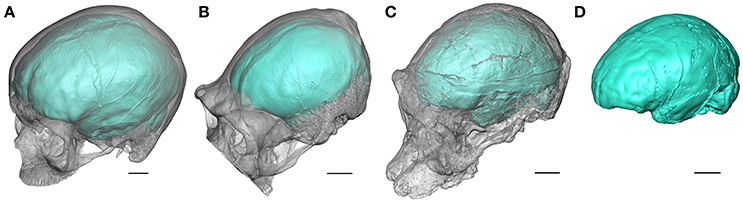
Endocasts of Homo sapien, Pan troglodytes, and Australopithecus africanus (Beaudet A., 2017).

How are the remains of hominins found at archeological sites used to make inferences about them? We shall walk through the journey of a hominin fossil after it is discovered at a site and processed at a lab with the help of a crude example.
Paleoanthropology is the study of hominins, through their bodily and artefactual remains. It largely relies on making comparisons between the fossils of extinct and extant hominins and sometimes hominids, due to the relative paucity of extinct hominid remains. There are certain tasks before such comparisons can be made.
Digitization and (Re)construction
After the steps necessary for its conservation are undertaken, fossils these days are digitized to virtually slice open and peer through them, allowing the collection of data which would otherwise be inaccessible. This is best done with the help of volumetric scanners, such as Computed Tomography (CT), microCT, Magnetic Resonance Imaging (MRI), and synchrotrons, varying in image resolution and feasibility. Lesser expensive techniques include using surface scanners such as the Breuckmann scanner, laser scanners, or even your phone camera (photogrammetry)!
These scanned 3-D files can be worked on using certain software such as Slicer to manipulate, correct distortions, and reconstruct missing parts of the fossils and in some cases, soft tissue based on patterns seen in the same fossil, or through reference collections. These can also then be exchanged and printed into casts, making it safer and more convenient to study and transmit knowledge among experts and the public.
Once such information is extracted through a single specimen, begins the process of anatomical comparisons using geometric morphometrics. This is a modern-day technique to minimize the influence of variation in the absolute size of crania and that of the scanned 3-D models itself (because of differing reference scales) on the comparative study.
To make the comparisons between fossils of the same bone/complex between specimen, corresponding points on the fossils, called ‘landmarks’ are first defined. These can be based on unique biological characteristics of the bone, geometric features on the bone, or those dependent on other landmarks.
An Example
Skulls belonging to gorilla, chimpanzee, modern human, Paranthropus boisei, Homo ergaster, and fossil Homo sapien are compared investigating phylogenetic relationships and cranio-morphological differences.
3-D scans of contemporary and fossil crania from the open-source online repository MorphoSource were used for the analysis. These included 10 samples of Gorilla gorilla, 10 samples of Pan troglodytes (chimpanzee), 10 samples of modern humans from various geographical distributions, and a sample each of Paranthropus boisei (OH 5), Homo ergaster (KNM ER 3733), and a fossil of Homo sapien (from Skhul, Israel).
Ten landmarks were selected across the crania to provide comprehensive information on skull shape. These landmarks are located on the following anatomical points.
| N. | Landmark | Description |
| 1. | Prosthion | Anterior and inferior midpoint of the maxilla. |
| 2. | Nasion | Midpoint of the nasofrontal suture. |
| 3. | Glabella | Midpoint most protruding above the nasofrontal suture, between the arches orbital. |
| 4. | Orbital Frontomalar (L) | Left point located on the orbital rim, on the anterior part of the suture frontozygomatic. |
| 5. | Orbital Frontomalar (R) | Right point located on the orbital rim, on the anterior part of the suture frontozygomatic. |
| 6. | Bregma | Upper and middle point of the frontal, usually located at the junction of the sutures coronal and sagittal. |
| 7. | Opisthocranion | Median point of the skull furthest from the glabella. |
| 8. | Basion | Anterior midpoint of the foramen magnum. |
| 9. | Porion (L) | Highest point of the superior border of the left external auditory meatus, forward and level of the spina supra meatum. |
| 10. | Porion (R) | Highest point of the superior border of the right external auditory meatus, forward and level of the spina supra meatum. |
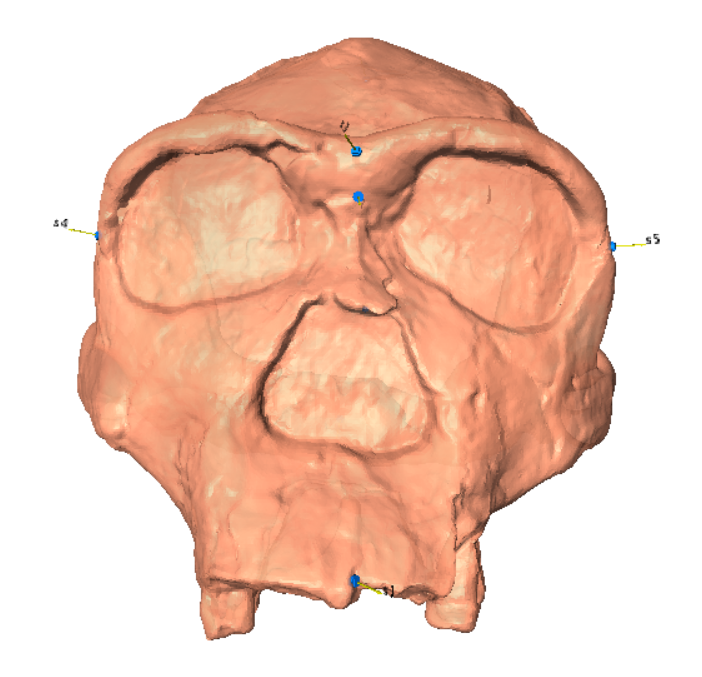


Fig. 1: Anterior, lateral, and inferior views of the Homo ergaster KNM ER 3773 cranium with landmarks.
The software Landmark Editor v3.0.0.7 by IDAV was used to plot and calculate each landmark’s absolute X-Y-Z coordinate values, although better suited software are available. To optimally align corresponding landmarks across crania against each other and make accurate comparisons, we use Generalized Procustes Analysis.
Generalized Procrustes Analysis (GPA)
Generalized Procrustes Analysis (GPA) is a statistical method used in multivariate analysis and data alignment. It is often used in shape analysis but can also be applied to other types of data. In GPA, multiple sets of data, often representing different shapes or configurations, are aligned to a common coordinate system. This is achieved by scaling, rotating, and translating the data points so that they best fit together. The method finds the optimal alignment of the data by minimizing the sum of squared differences between corresponding points across all the datasets.
GPA has been used in this study to minimize the influence of variation in the overall size of crania and that of the scanned 3-D models itself (because of differing reference scales) on the comparative study. The GPA-transformed coordinates of the landmarks are solely based on the variation in shape of the crania and are hence a more accurate measure of inter-species variability.
The software Paleontological Statistics (PAST) v4.03 was used to first transform the previously measured landmark coordinates using 3D procrustes to remove the influence of size and orientation of landmarks on the scanned crania, and then visualized in a Principal Component Analysis plot.
Principal Component Analysis (PCA)
Principal Component Analysis (PCA) is a statistical technique used to simplify complex data, visualize high-dimensional data, and identify underlying patterns in data. PCA is used to identify patterns and relationships in a dataset by transforming the original data into a set of linearly uncorrelated variables called principal components. Reduction in the number of variables in a dataset while retaining as much of the original variation as possible is achieved by identifying the principal components that explain the most variance in the data. The first two principal components are the directions of greatest variance in the data and are hence primarily used in the plot.
In the present study, the GPA-transformed coordinates of landmarks were used in PCA to qualitatively assess inter-species variation among various hominids of the past and present based on the chosen landmarks.
Results
The resulting scatter plot using PCA termed morphospace (Fig.s 2 and 3) is mostly consistent with the generally accepted phylogeny. There is a clear clustering of gorilla, chimpanzee, and modern human groups of individuals, although a slight overlap exists between gorilla and chimpanzee.
The P. boisei from OH 5 is located roughly between, although below gorilla and chimpanzee. serves to disprove the linearity of evolution, especially that of humans. Being the most robust of its genus, “Zinj” lived approximately 1.8 million years ago and had developed powerful jaw muscles and large molars capable of grinding hard foods, although it was likely a generalist. In contrast, chimpanzees diverged from the hominin line 6-8 million years ago but evolved craniofacial features “statistically closer” to sapiens than P. boisei did, also evidenced to being omnivores.
The 80000–120000-year-old sapien from Skhul is the closest fossil used in this study to modern humans. However, it is not within the convex hull of modern humans indicating that significant changes have occurred in sapien crania ever since, questioning the usage of the term “anatomically modern humans” to refer to all sapiens after 300000 years.
H. ergaster from Koobi Fora is located almost exactly midway between P. boisei and sapien (Skhul) on the morphospace, which is expected, given that it lived approximately 1.6 million years ago and was a member of our genus.
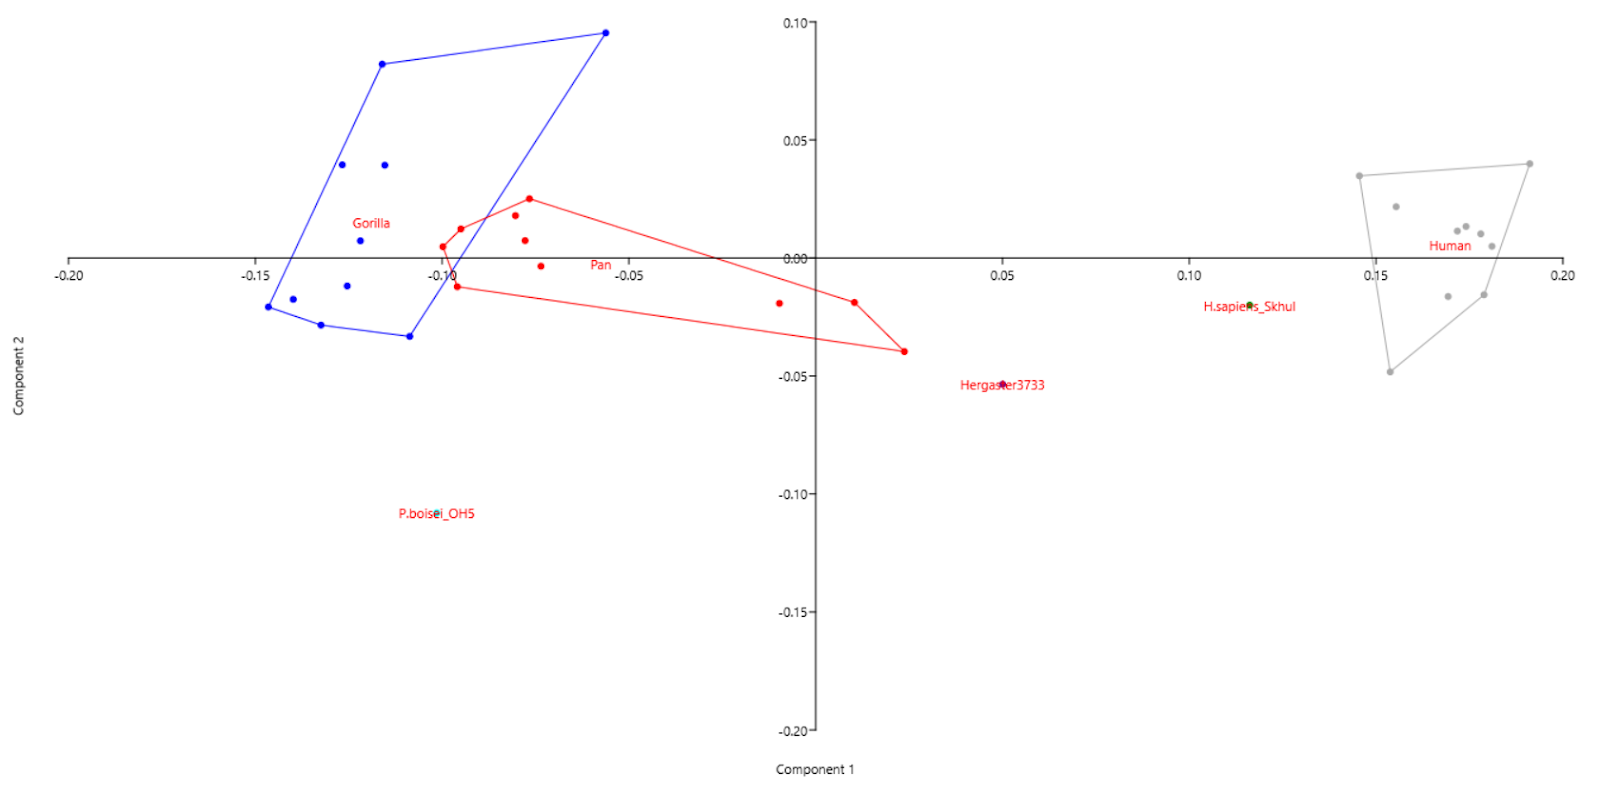
Fig. 2: Scatter plot of PCA without biplot.
Further, it can also be seen in Fig. 3 that raw coordinates 19, 20, and 30 vary the most along PC 2 and hence are the greatest differential between gorilla, chimpanzee and modern humans. These correspond to X and Y-coordinates of opisthocranion and the Z-coordinate of the right porion. The high inter-species variability in X and Y-coordinates of the opisthocranion is indicative of the expansion of the occipital lobe in our genus and species, which is responsible for visual processing and recognition.
Among the fossils, raw coordinates 15, 16, 17, and 18 seem to vary the most, which correspond to the Z coordinate of the right orbital frontomalar and all 3 coordinates of the bregma. Raw coordinates 1, 4, 7, 10, 22, 23, and 27 vary the least, which correspond to the X-coordinates of prosthion, nasion, left orbital frontomalar, basion, Y-coordinate of basion, Z-coordinates of glabella and left porion.
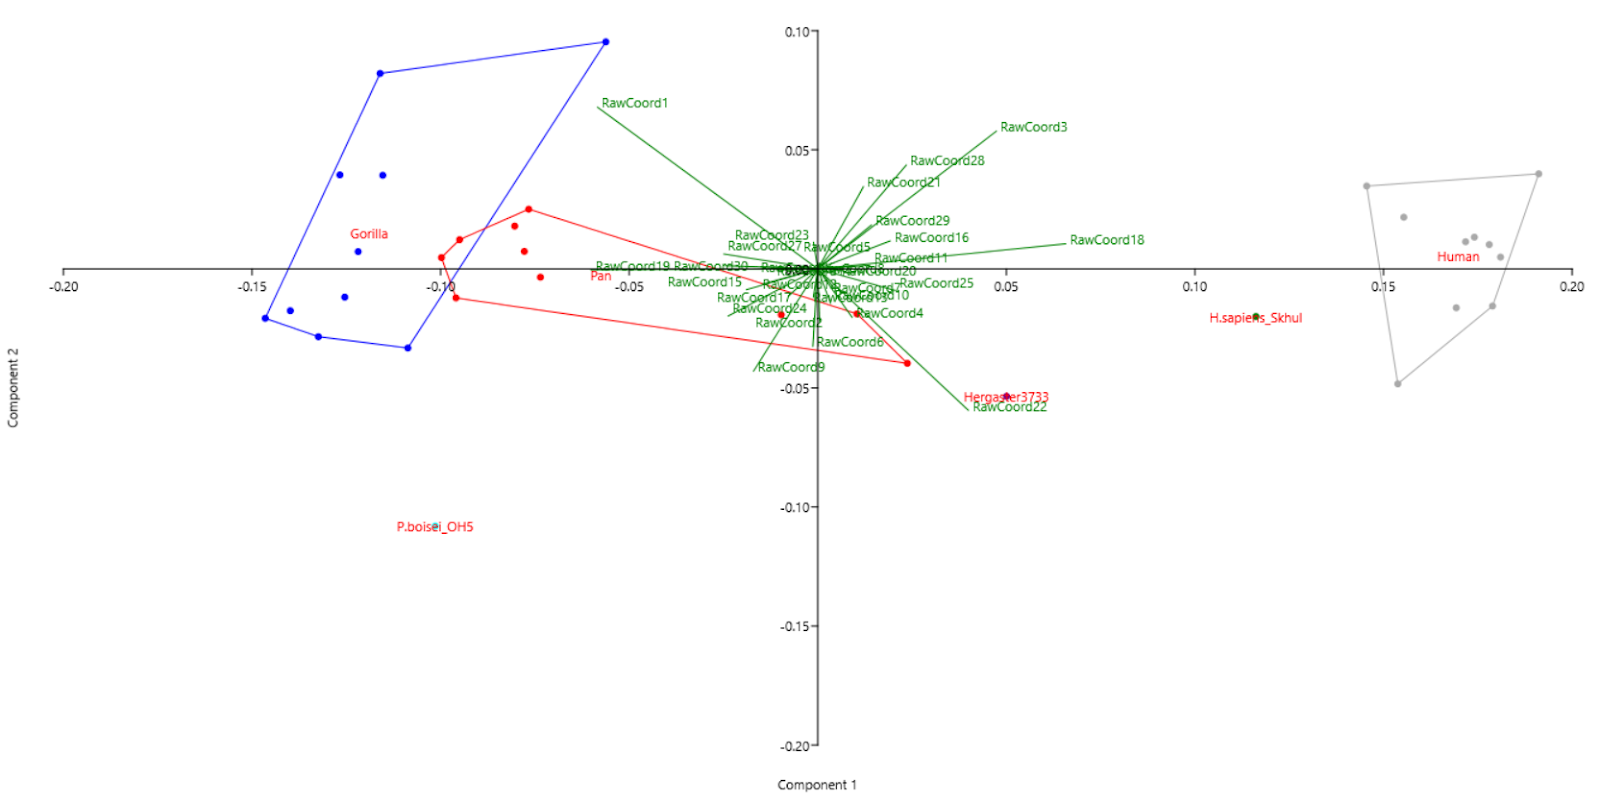
Fig. 3: Scatter plot of PCA with biplot.

Fig. 4: Coordinate axes.
Among fossil hominins especially, as we move from P. bosei to H. ergaster to H. sapien (Skhul) the progressive decrease in the Y-coordinates of bregma is due to the loss of the sagittal crest and keel. The increase in X and Z-coordinates indicates an expansion in the parietal and frontal lobes, which are associated with sensing, motor function, memory, and supposedly uniquely human traits such as language.
Thus, the study of our deep past today requires modern and futuristic tools while relying on multiple disciplines such as biology, geometry, statistics, and in less crude examples, computer programming.
References
- Beaudet A (2017) The Emergence of Language in the Hominin Lineage: Perspectives from Fossil Endocasts. Front. Hum. Neurosci. 11:427. doi: 10.3389/fnhum.2017.00427.
- https://humanorigins.si.edu/evidence/human-fossils/fossils/oh-5
- https://humanorigins.si.edu/evidence/human-fossils/fossils/skh%C5%ABl-v
- https://humanorigins.si.edu/evidence/human-fossils/fossils/knm-er-3733
- https://www.ncbi.nlm.nih.gov/books/NBK544320/#:~:text=The%20occipital%20lobe%20is%20the%20visual%20processing%20area%20of%20the,face%20recognition%2C%20and%20memory%20formation.
- https://my.clevelandclinic.org/health/body/24628-parietal-lobe
- https://my.clevelandclinic.org/health/body/24501-frontal-lobe
- https://www.morphosource.org/
- https://www.virtual-anthropology.com/virtual-anthropology/

This is a decent explanation of the how, but not the why? There is no anatomical justification for this approach. It is all math without much morphological and evolutionary justification. As one of the early users of morphometrics going back to the late 1960s, Ican say with certainty that the approach you describe is sterile. Paleoanthropology is more that “anthropology at the flip of a switch.”
LikeLike
What alternative do you propose? Until proteomics advances significantly, statistical analyses is all we can do on fossils older than 0.5 My.
Besides, evolutionary justification is the goal of Paleoanthropology. Recognizing differences between specimens is the first step towards it.
LikeLike